BIENDO
Application Design / Data Visualization
The application is a speculative companion app to a food detecting scanner that produces detailed visualization, information breakdown, and historical comparison of users' meals.
Roles
Researching / Designing / Prototyping
Timeframes
Timeframes
November - December 2018
Category
Data Visualization / Application Design / UXUI Design
Tools
Illustrator / Sketch / InVision
Initial Research
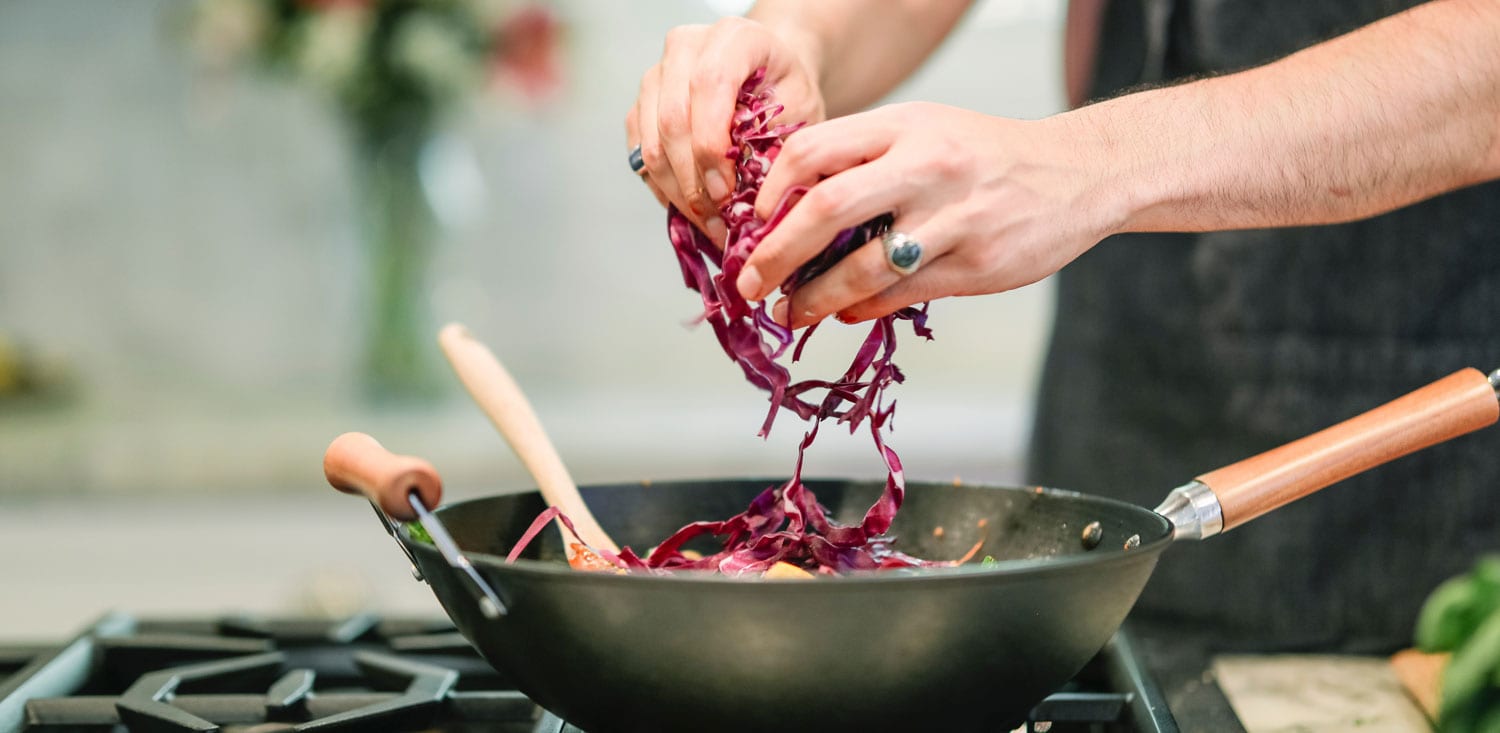
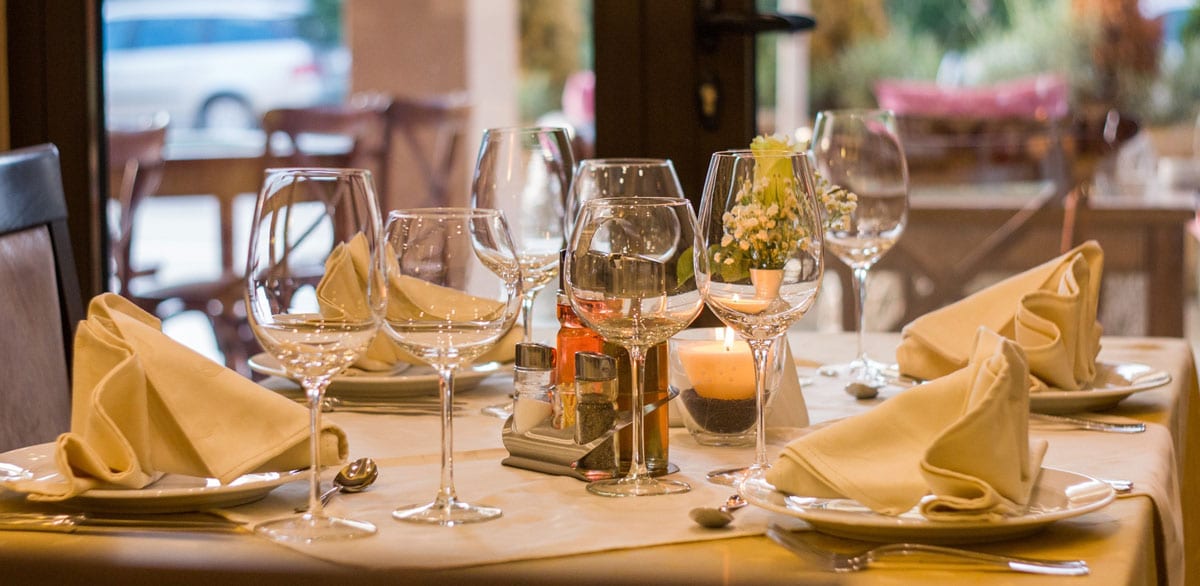
With the objective of the project being to create a companion app for a smart internet of things (IoT) device using principles of speculative design and data visualization; I wanted to build an easy-to-use product that the users can use whether it's at the comfort of their kitchen or dining outside with family and friends.
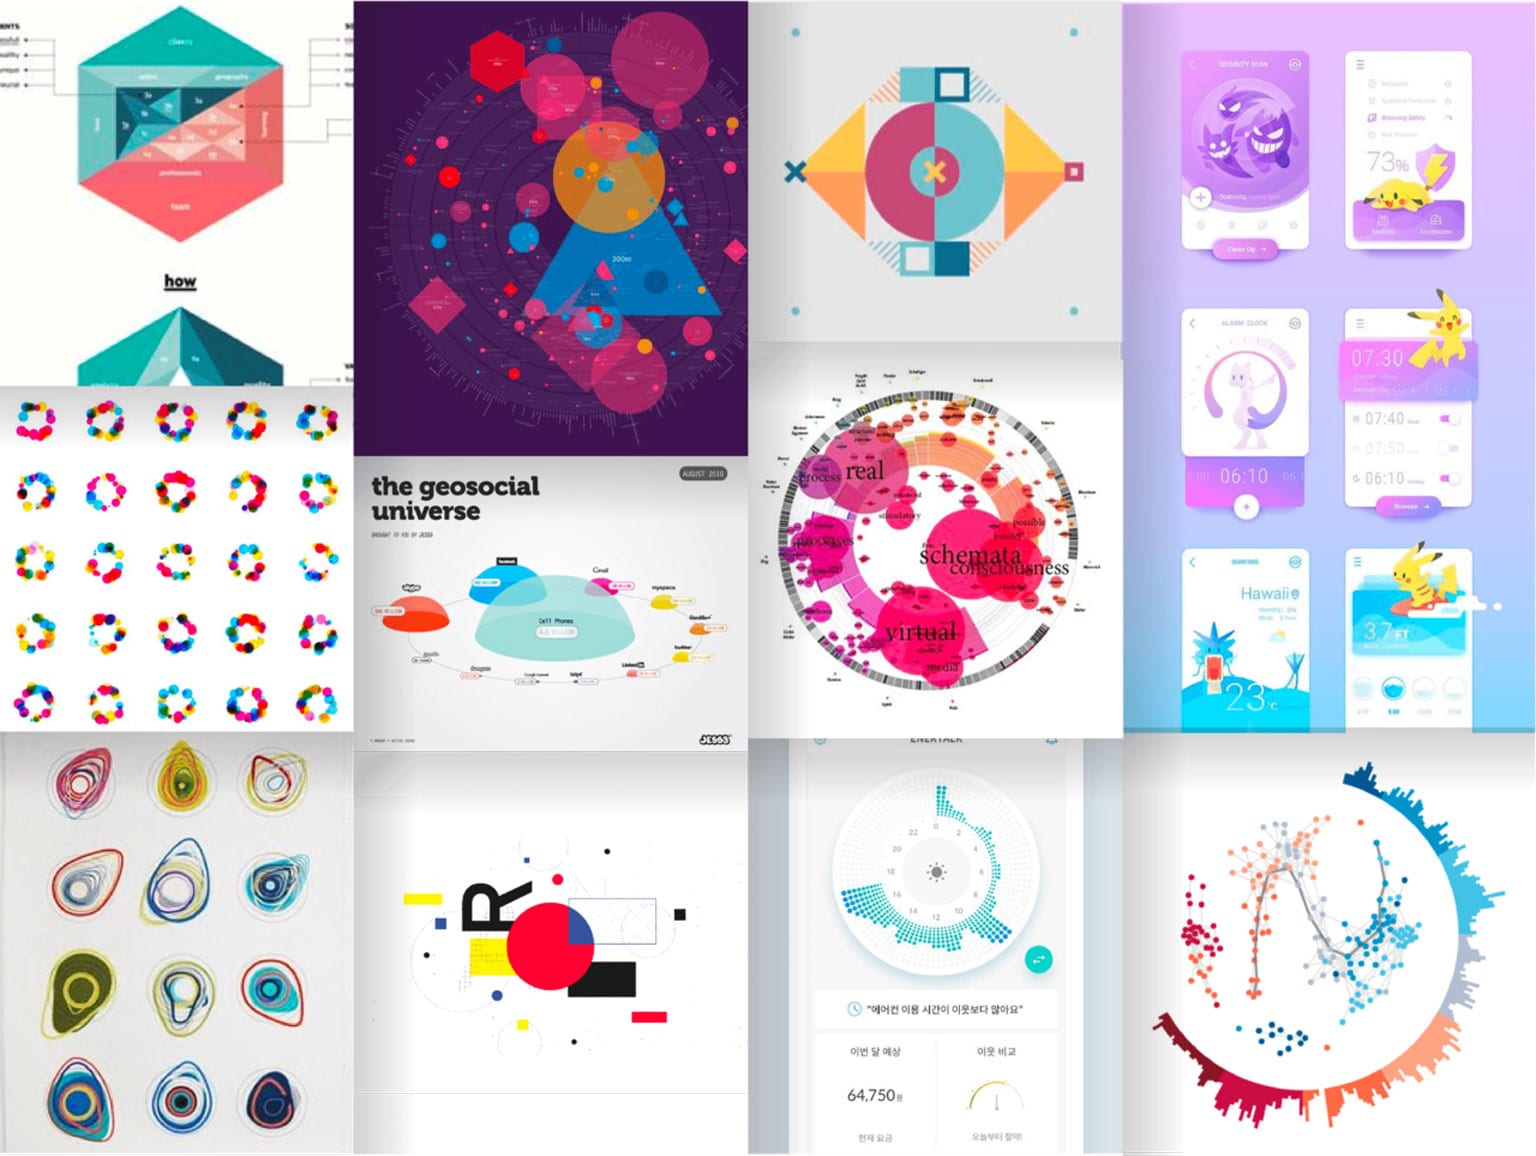
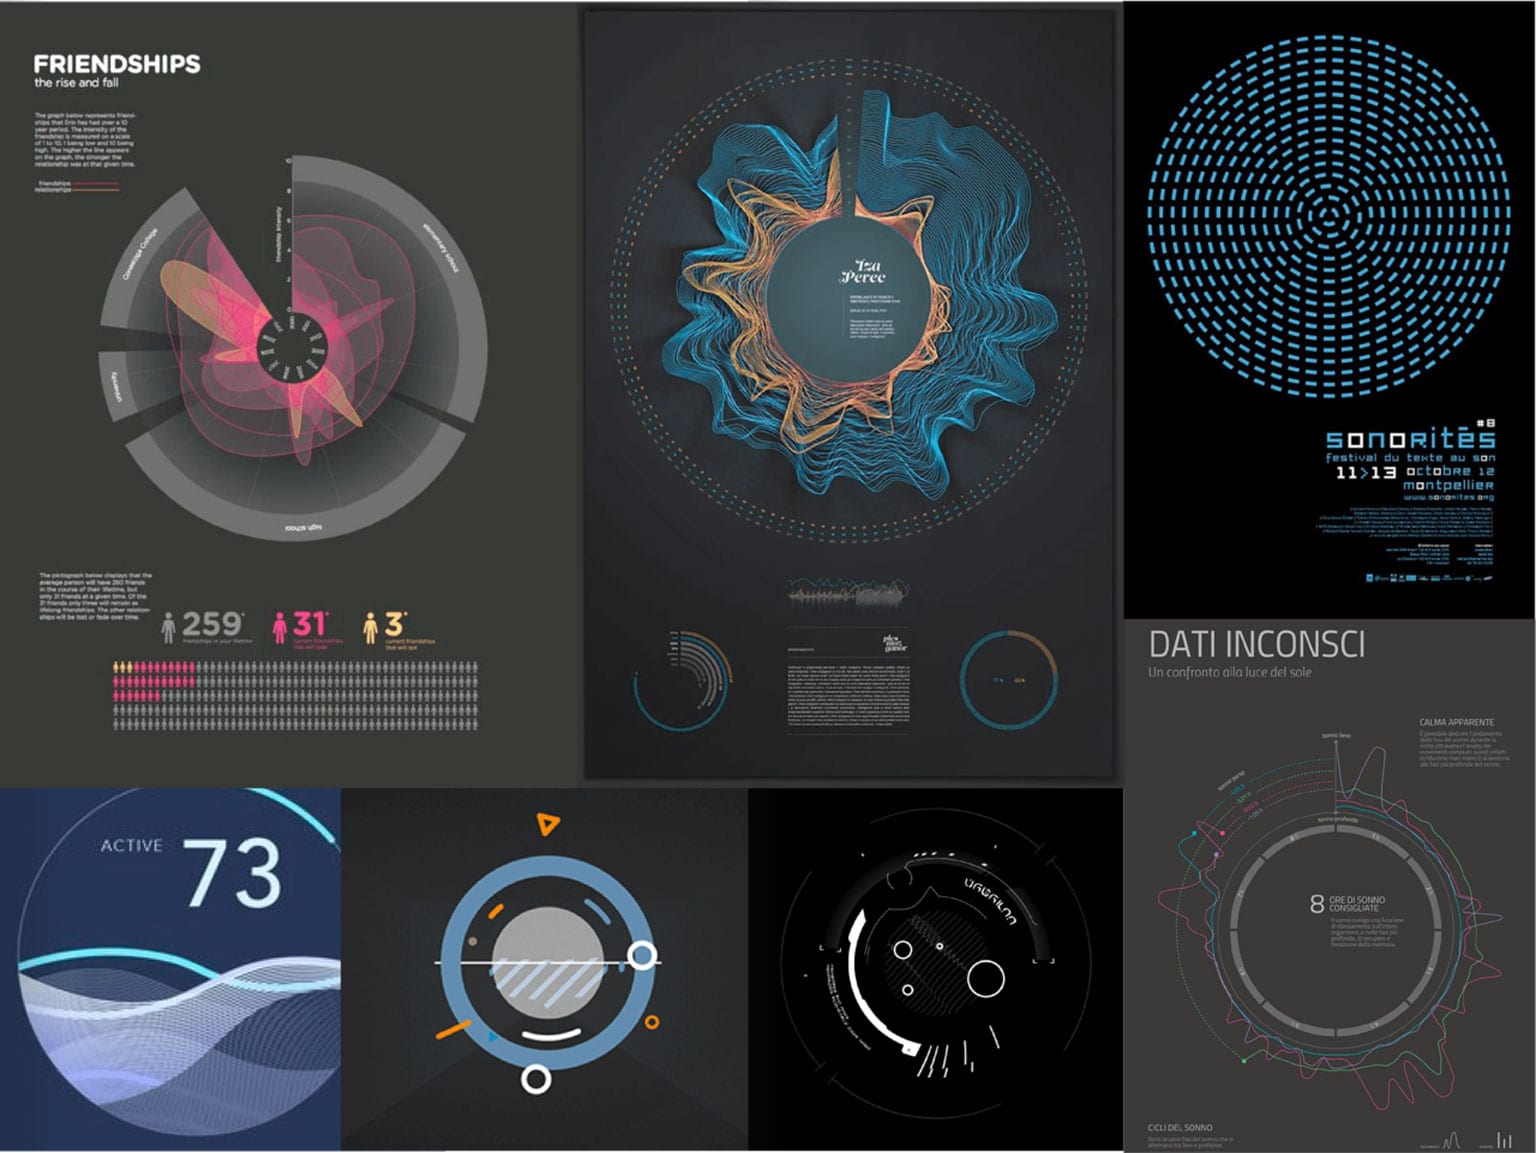
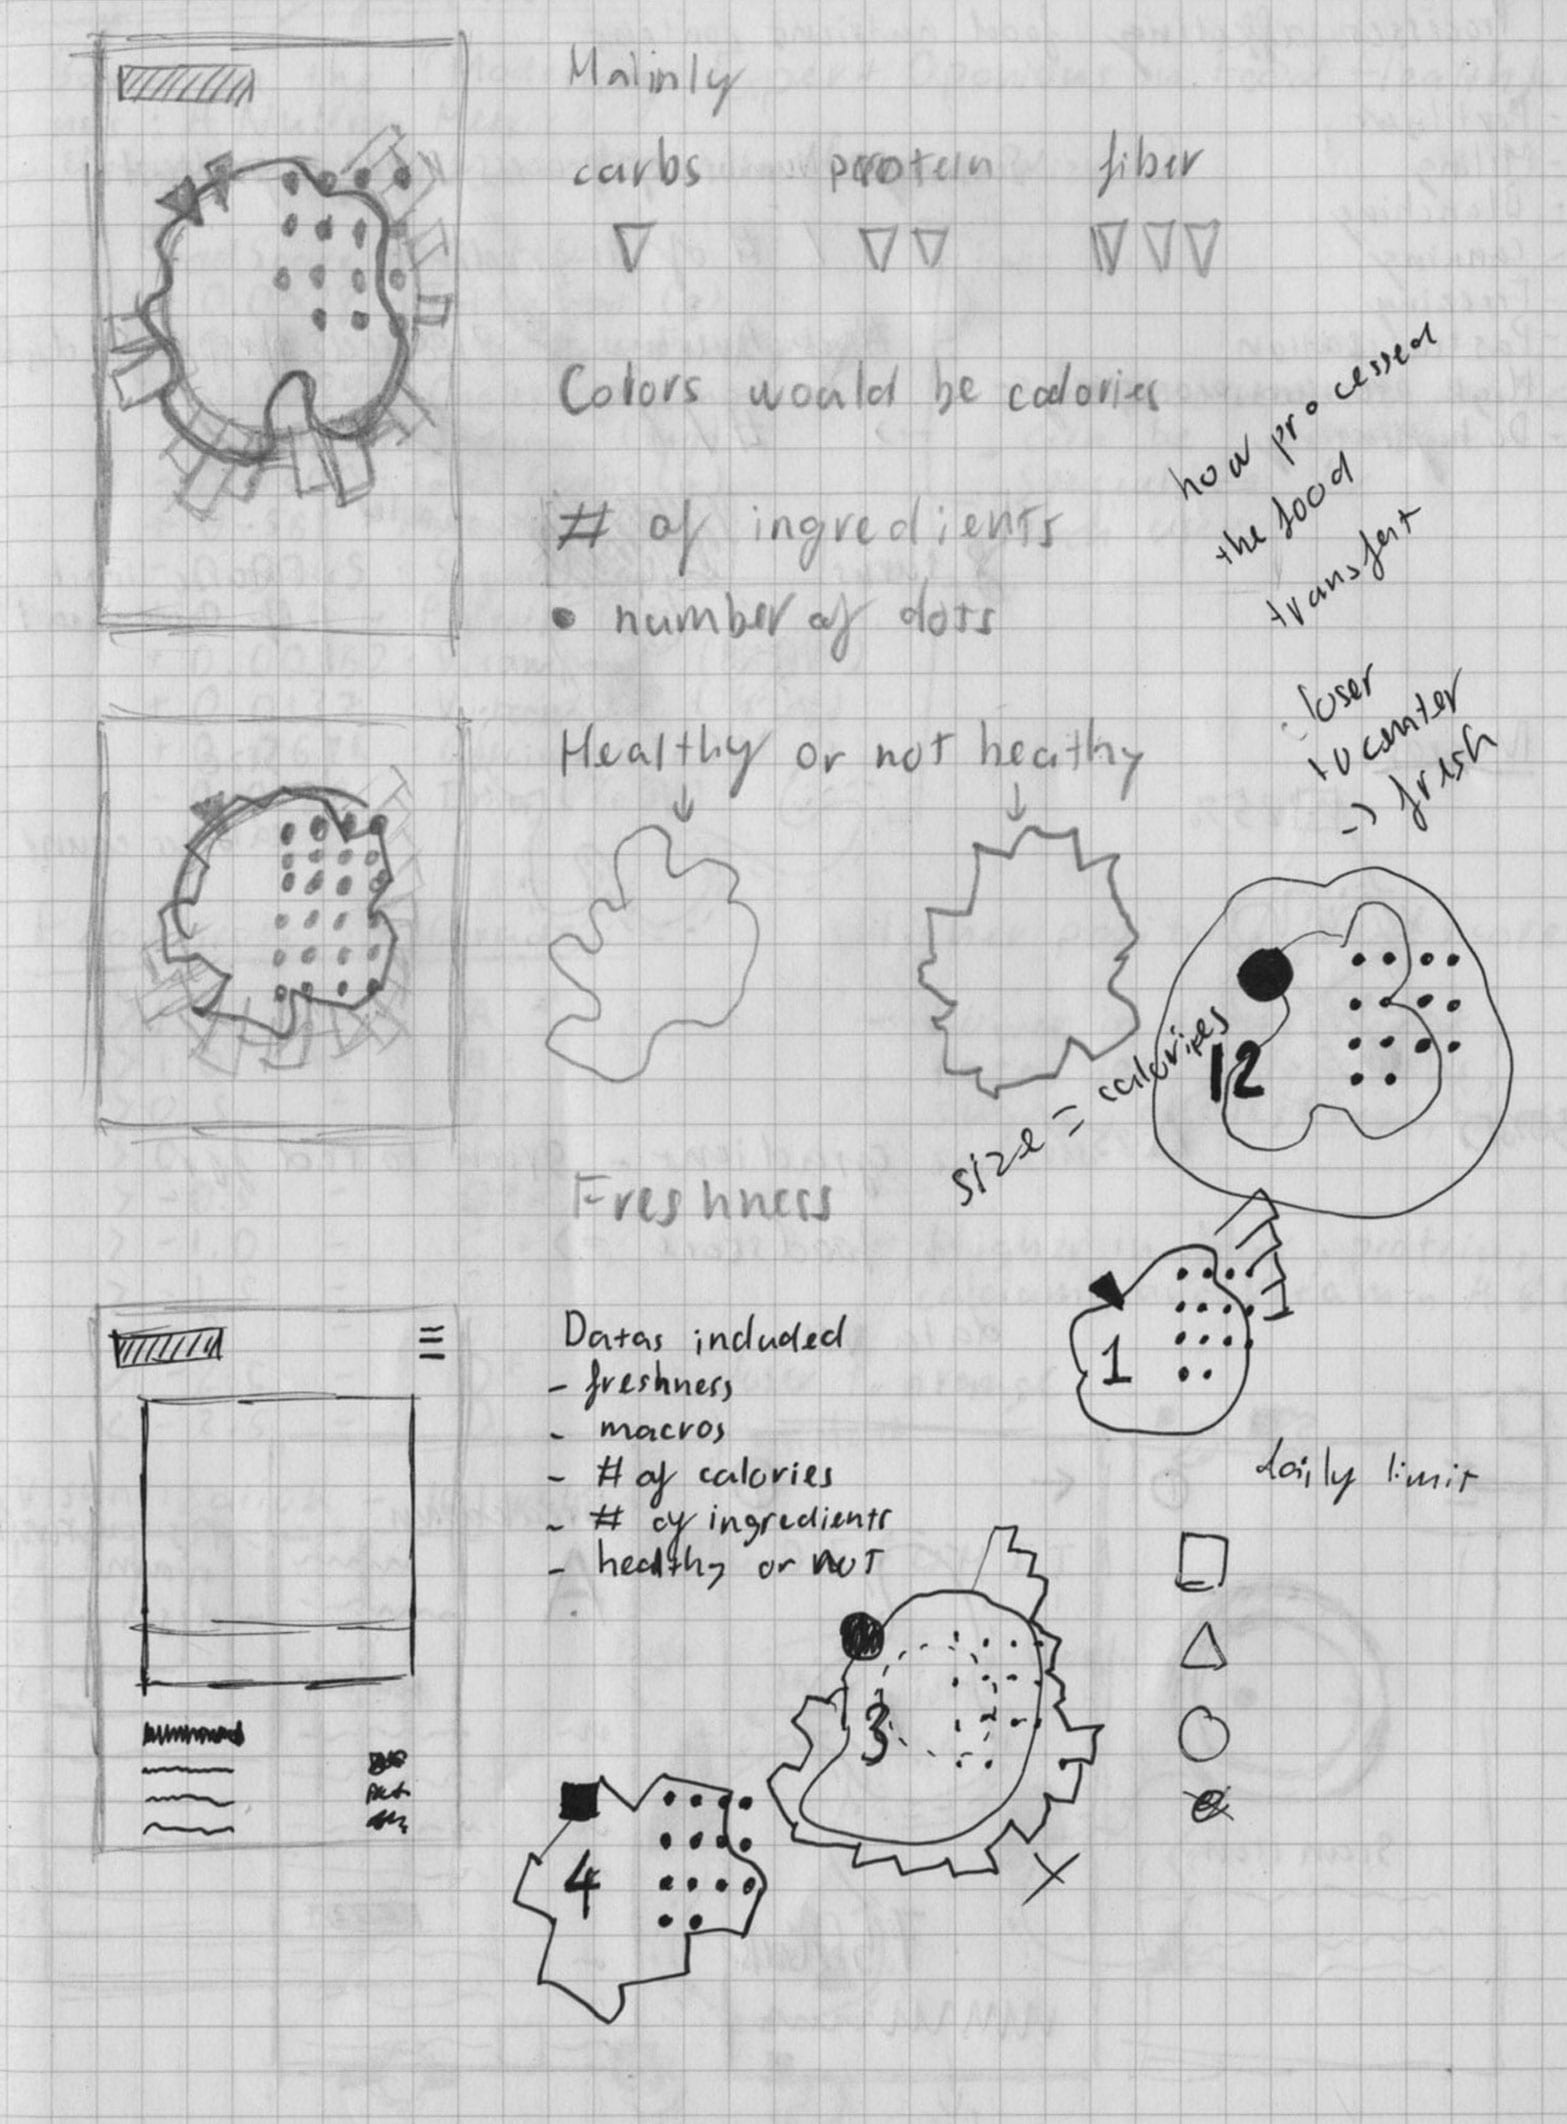
Ideation Process
The concept of this project started with the idea of combining abstract shapes, their locations, and their movements to visualize data. The mood-boards showcased various visualizations as well as bits of abstract illustrative and motion pieces that can help direct my model. In addition to the data visualization, the application will be typographic based which will help to solidify the abstractness of the app and differ from other applications in the market.
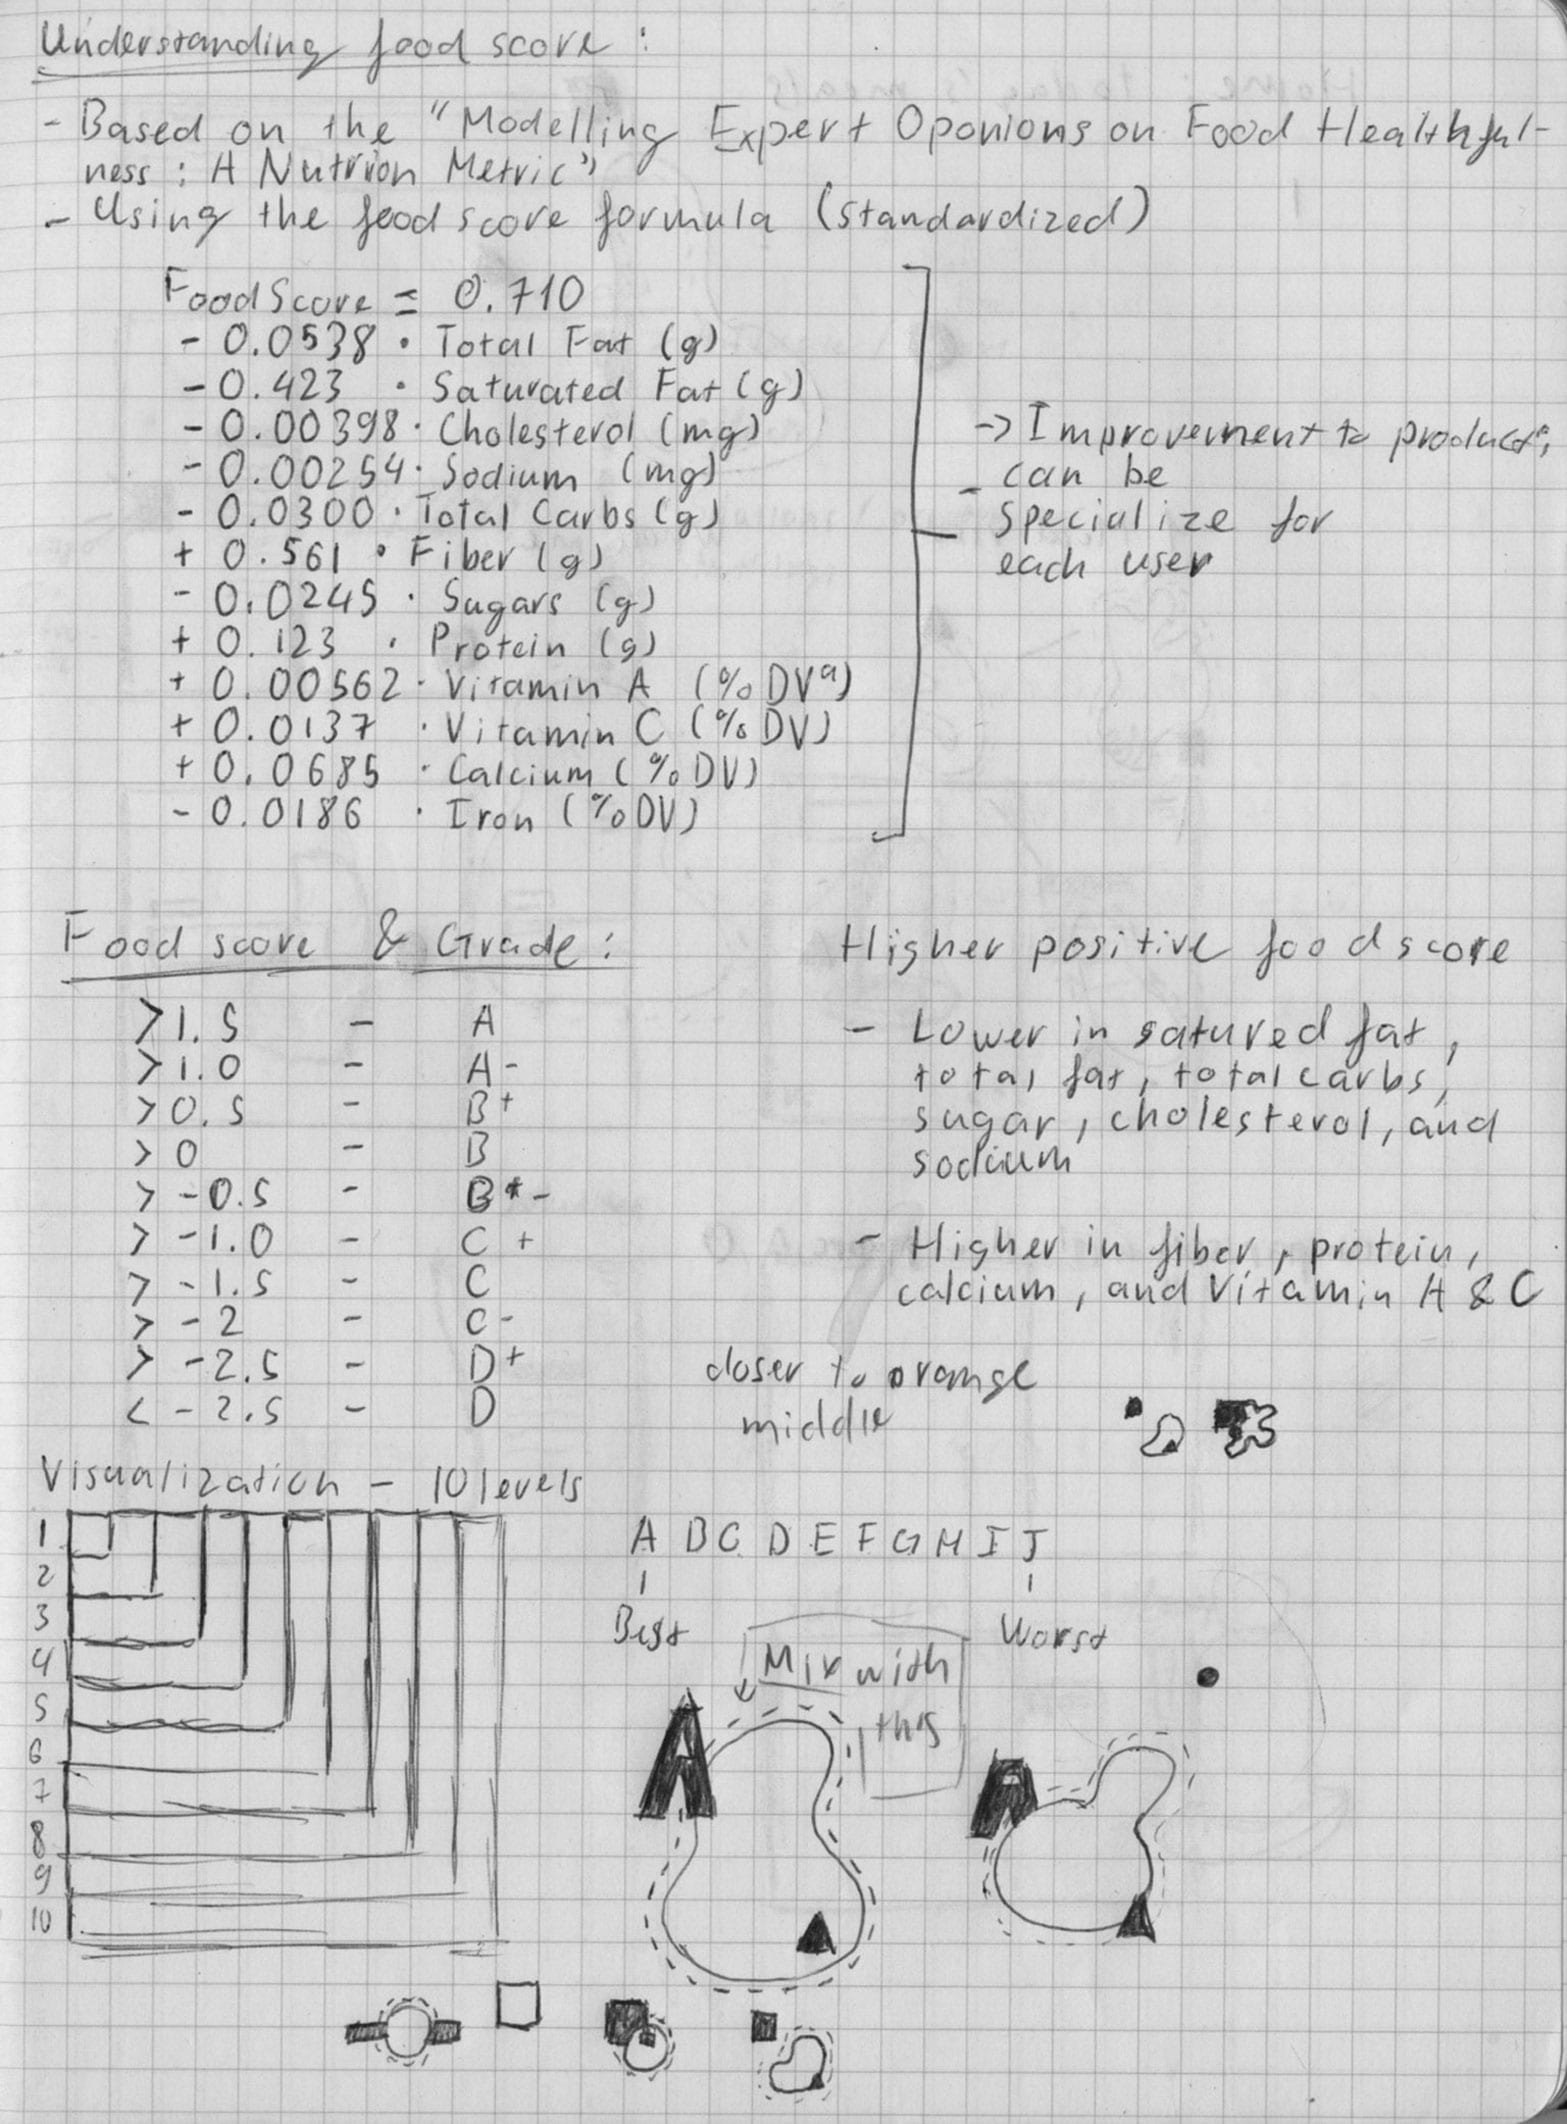
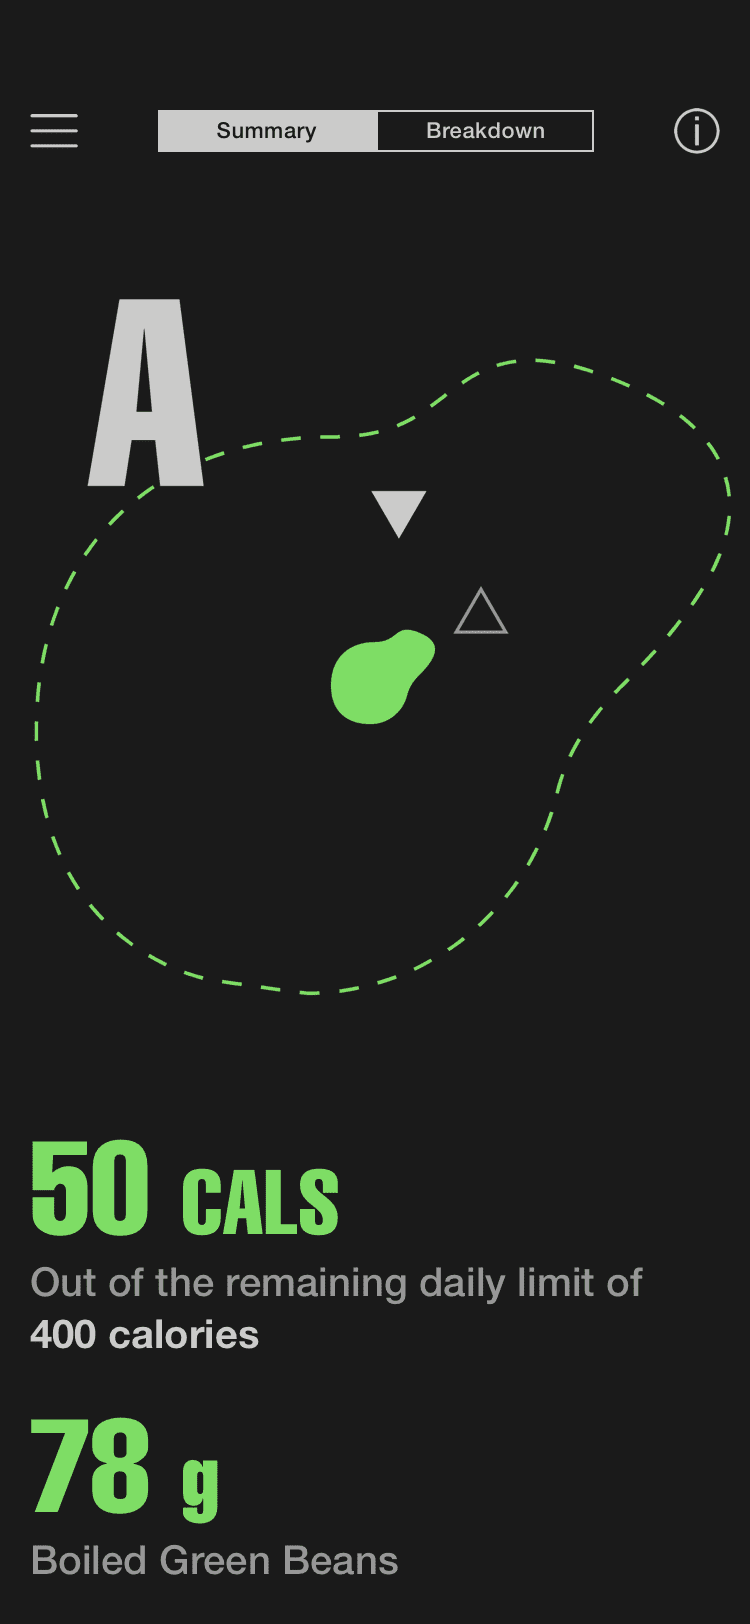
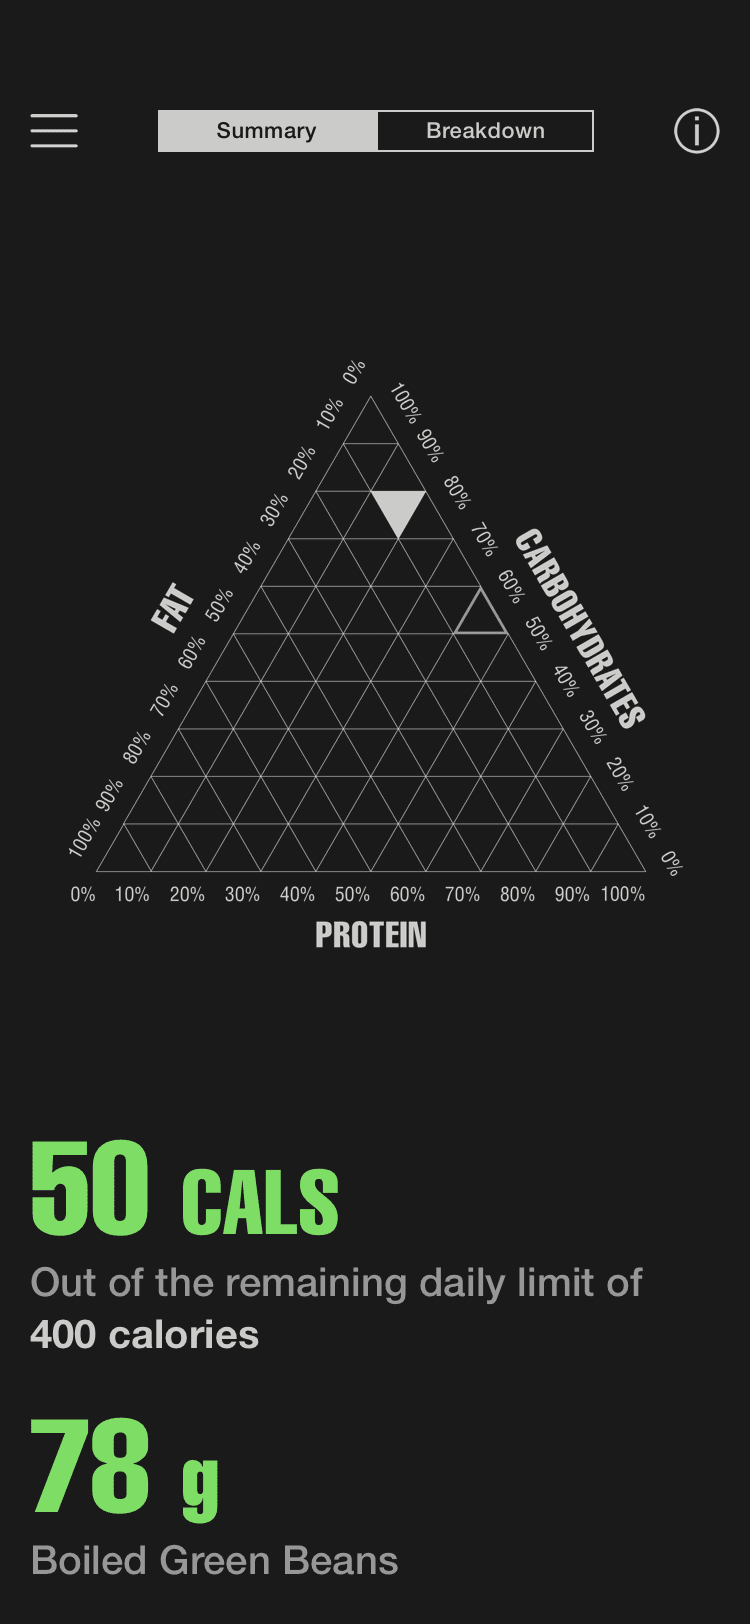
The application collects various forms of data like the daily caloric intake, macros (% of fat, carb, and protein), nutrient values and the number of processing methods applied to the dish (8 processing methods: fertilizing, milling, blanching, canning, freezing, pasteurization, high-pressure processing, and dehydrating). Then organize and analyze them to produce key features like caloric budgeting, historical comparison, food grading, and the number of processing methods applied to the dish. The primary component of the project is to assemble a visual model that can be easily deciphered by users to determine the "healthiness" of a disk.
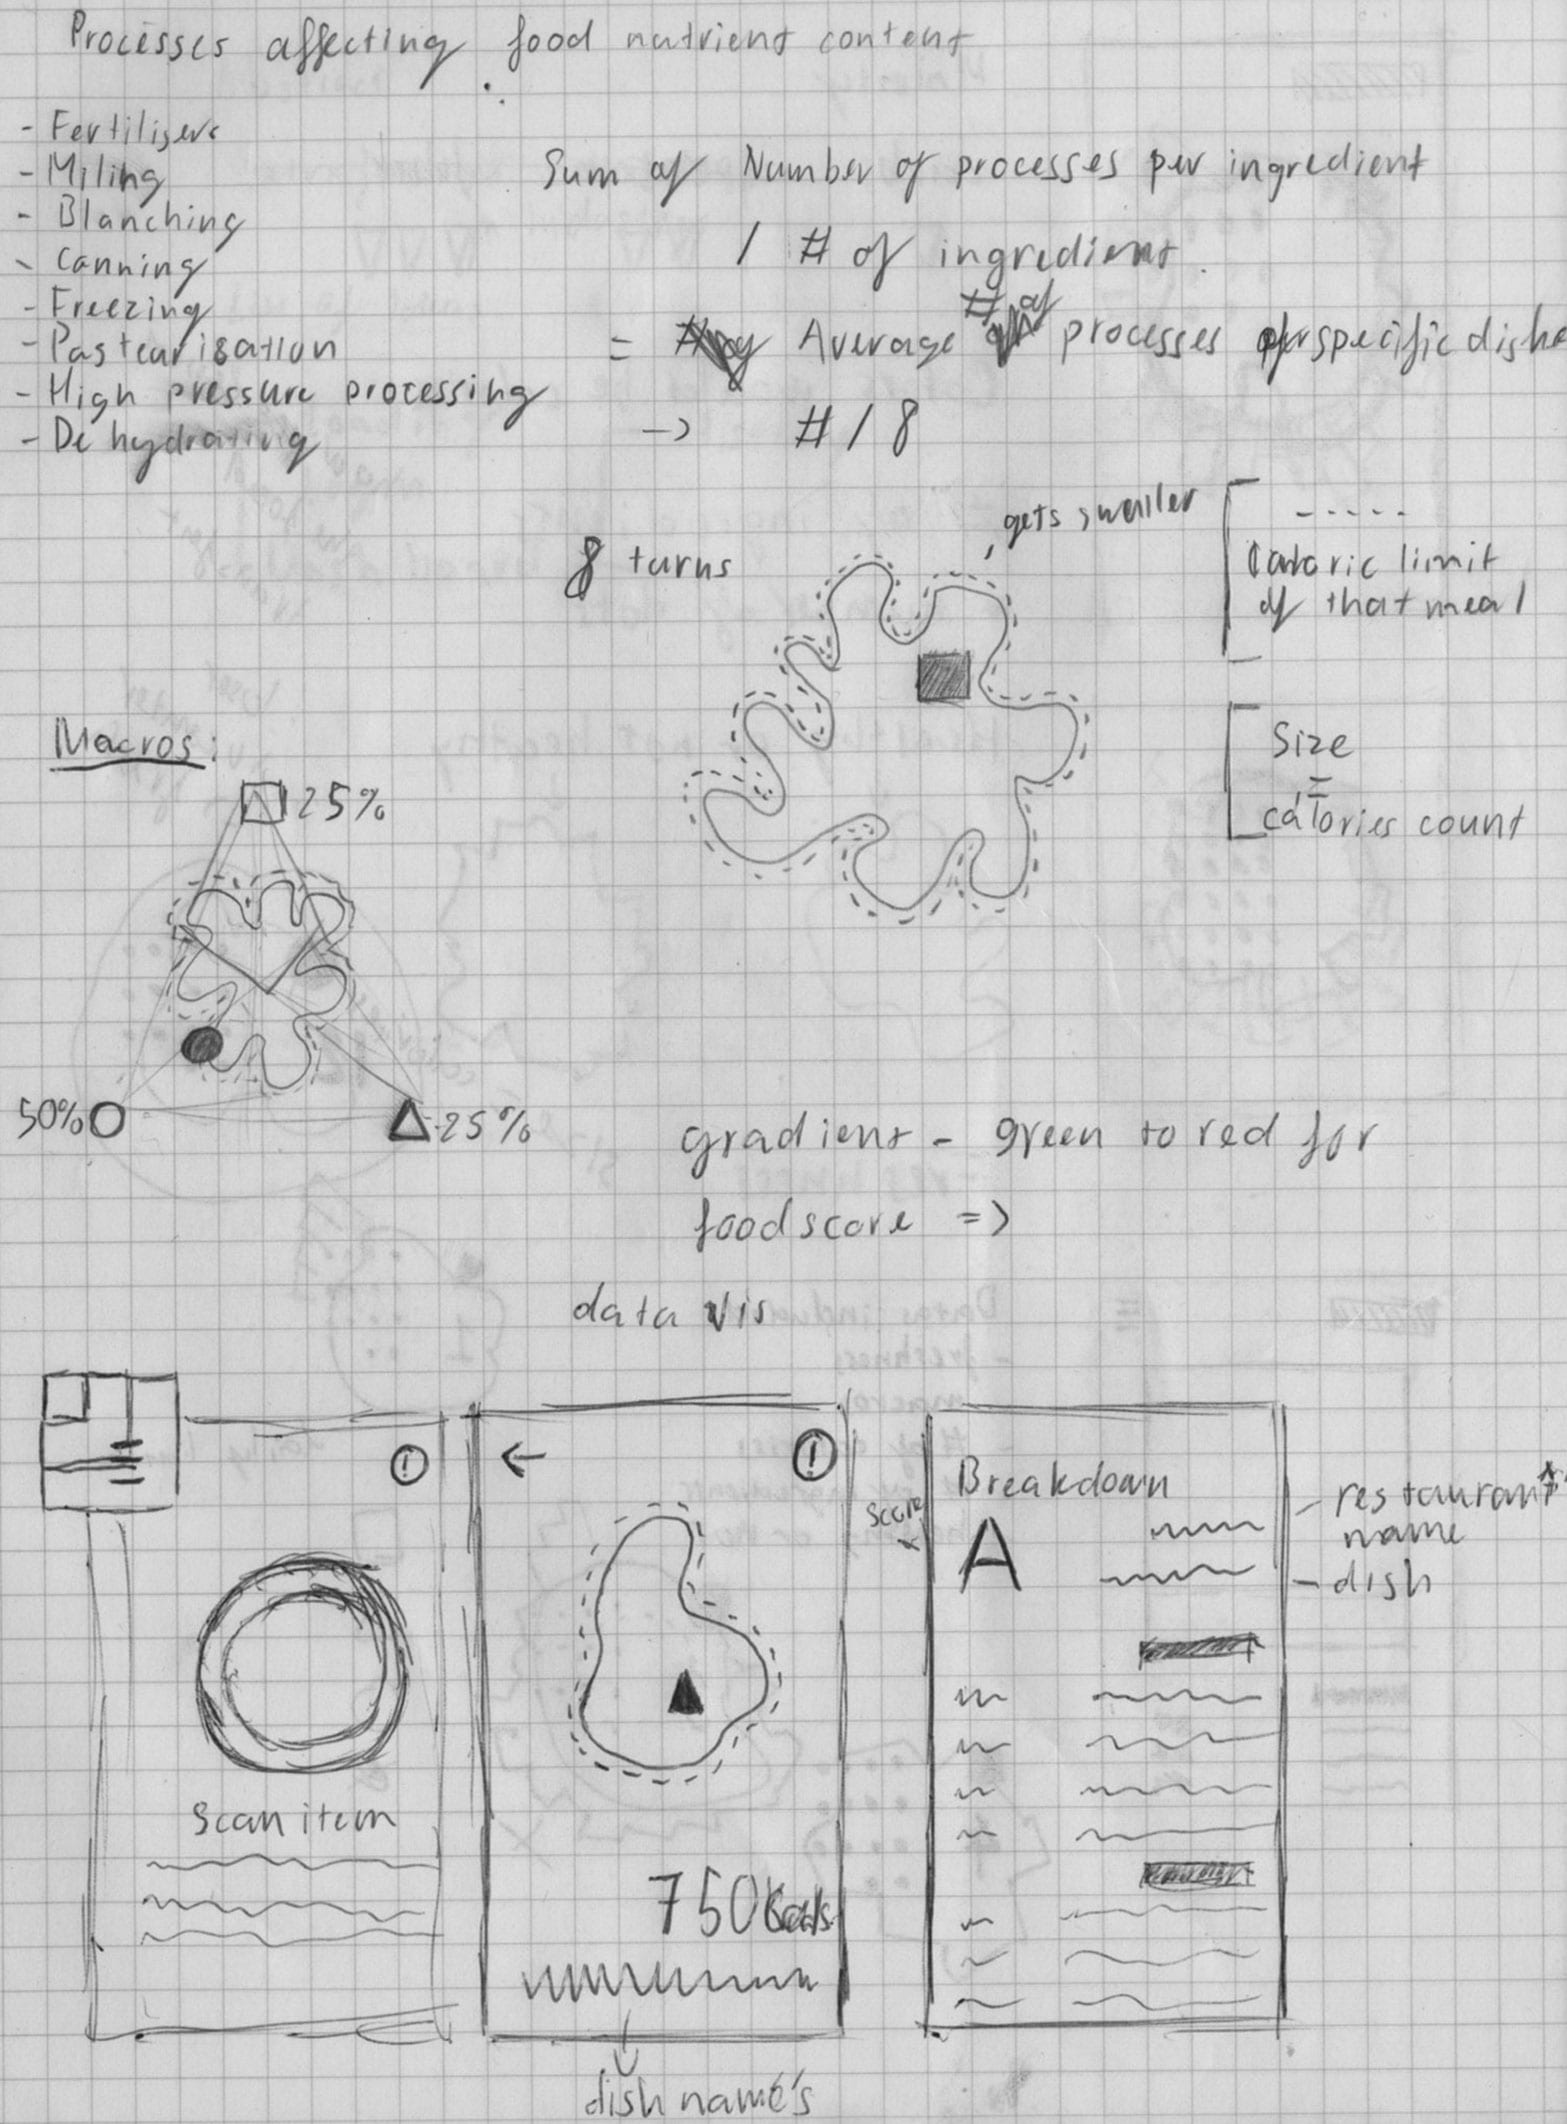
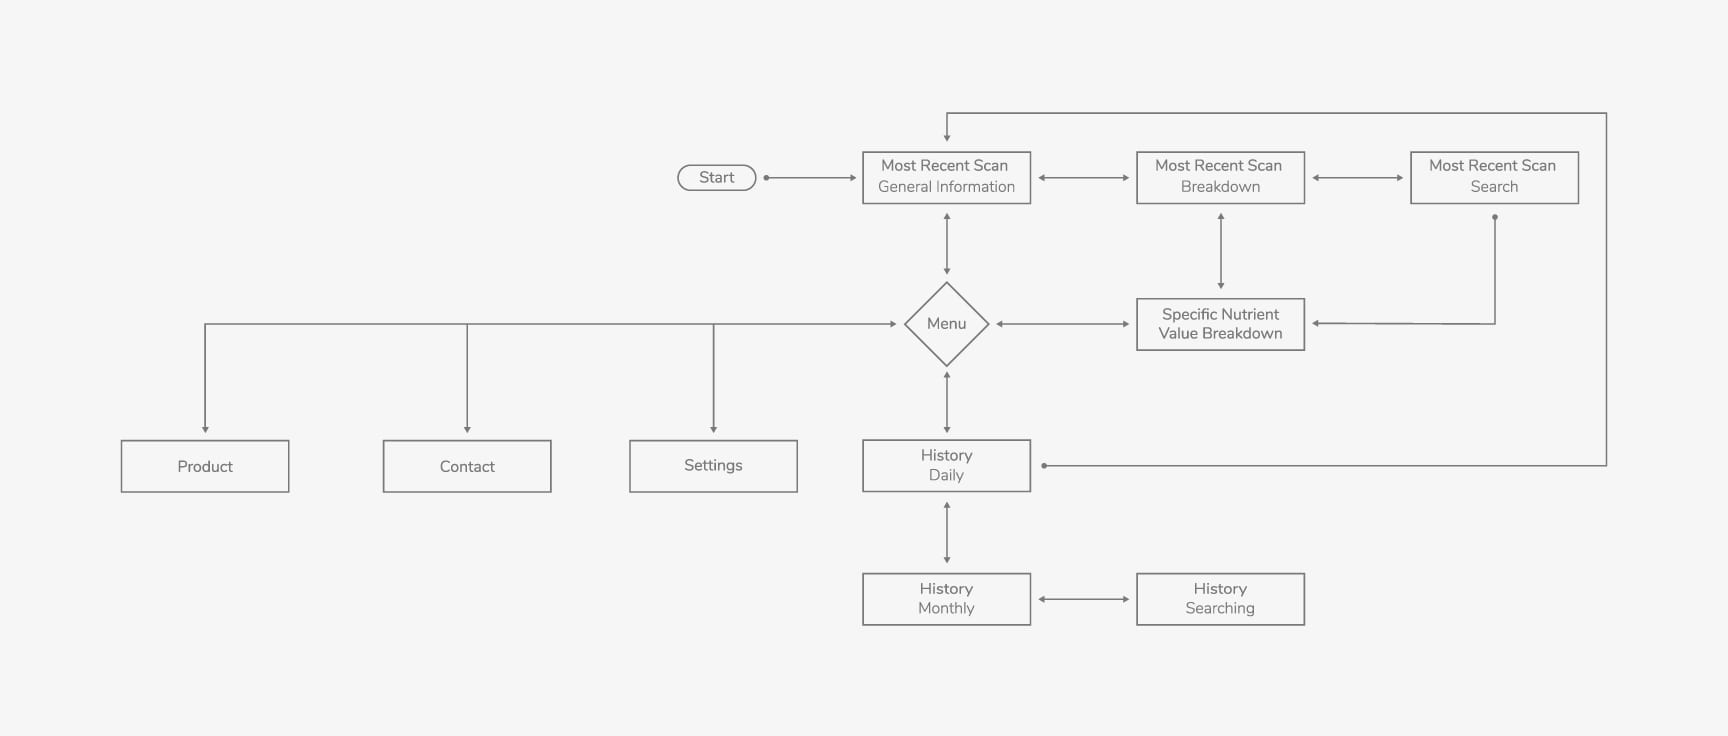
Due to the time restriction for the project, I decided to focus the project on the three most important features of the application, which are the data visualization, the information breakdown, and the historical comparison. This decision is reflected in my user flow
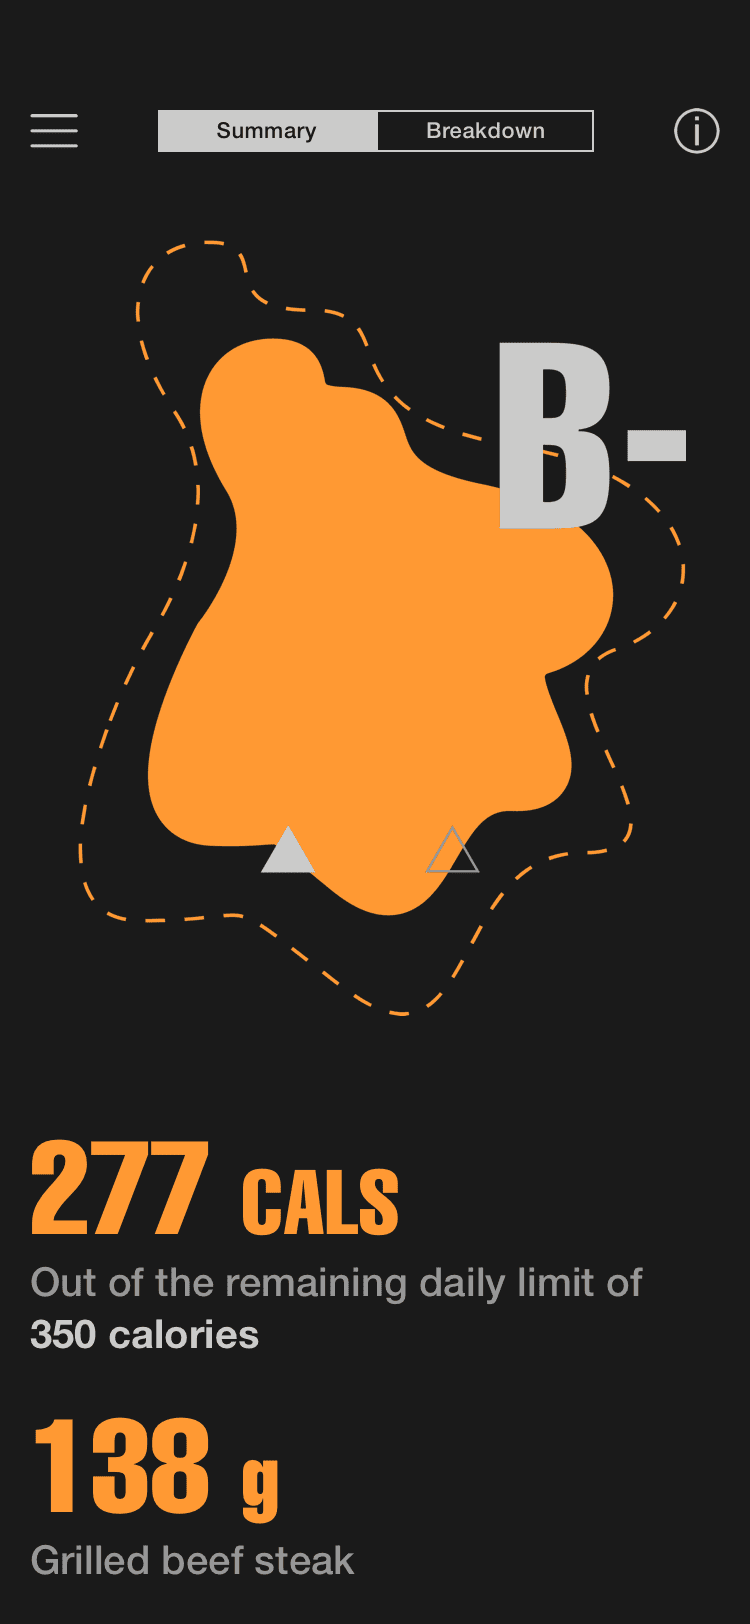
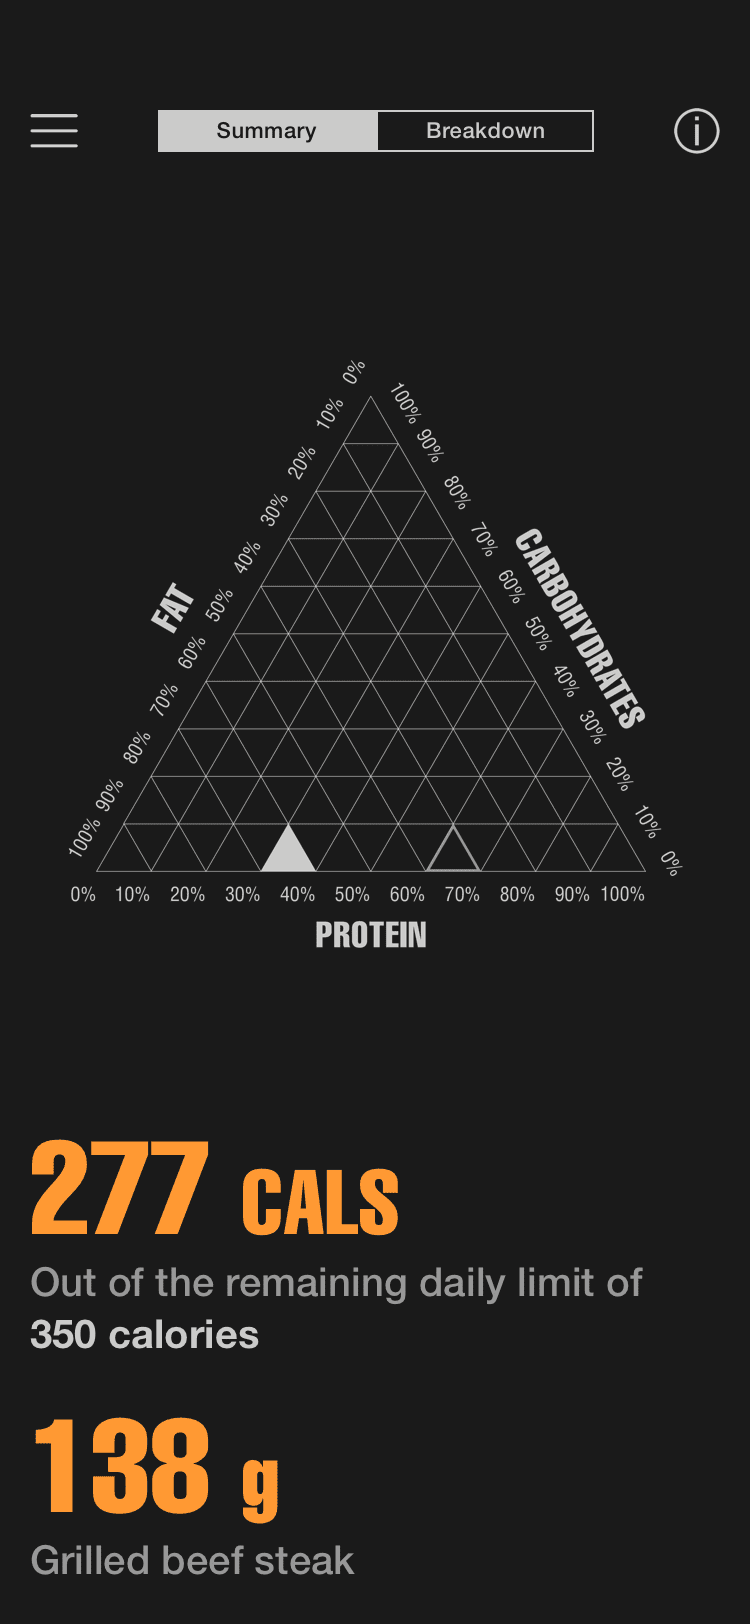
Visualization Model Breakdown
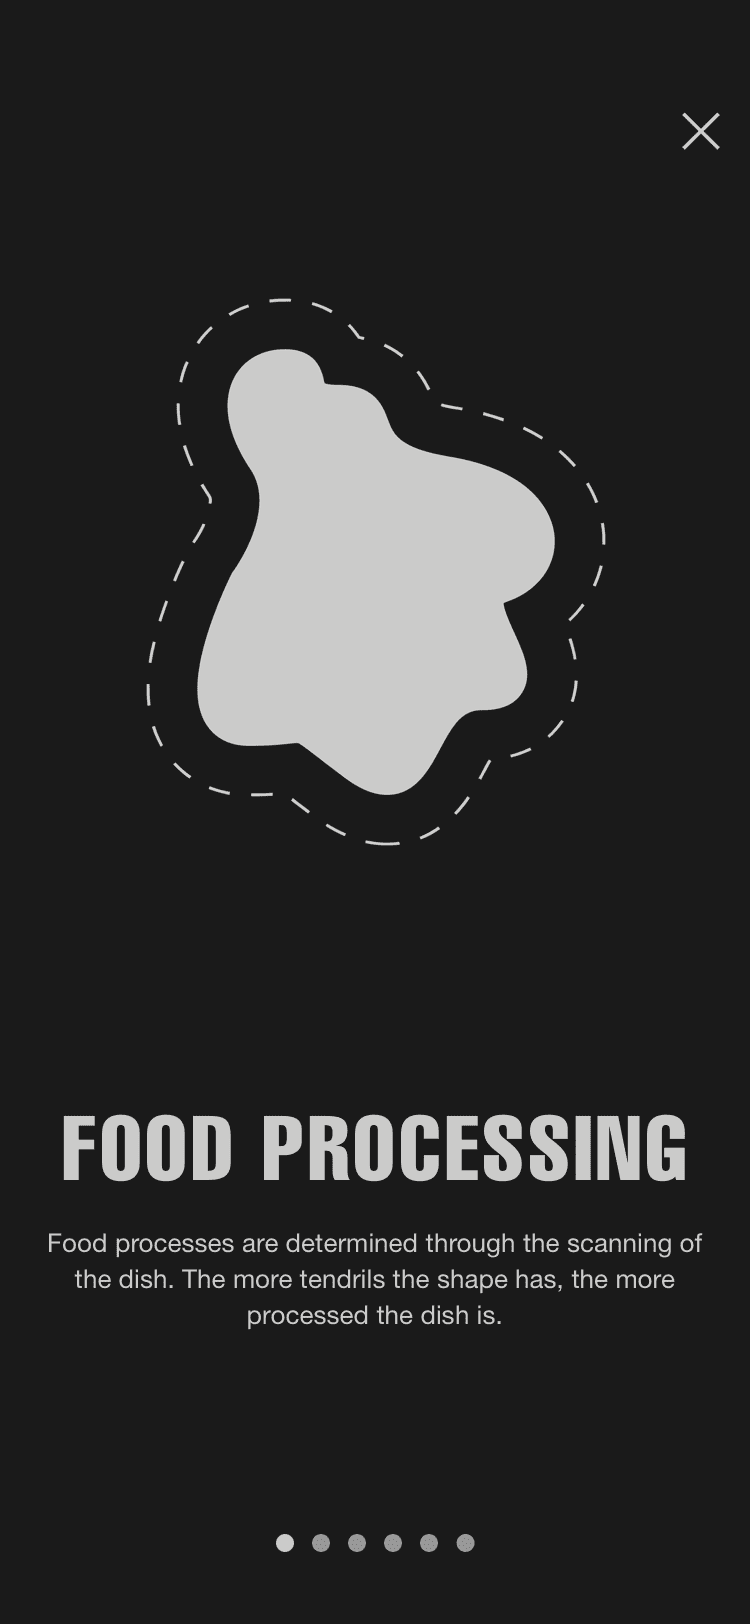
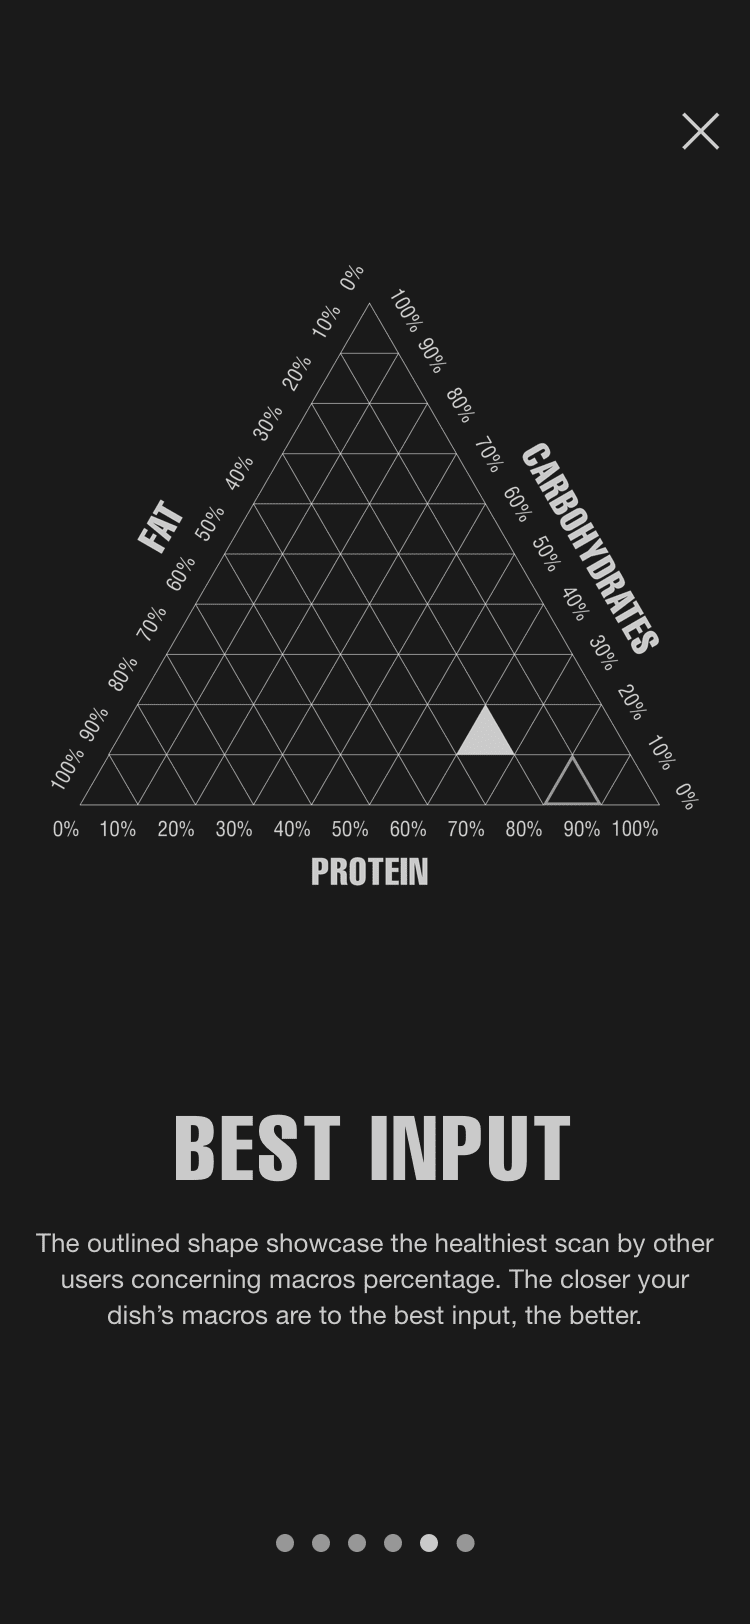
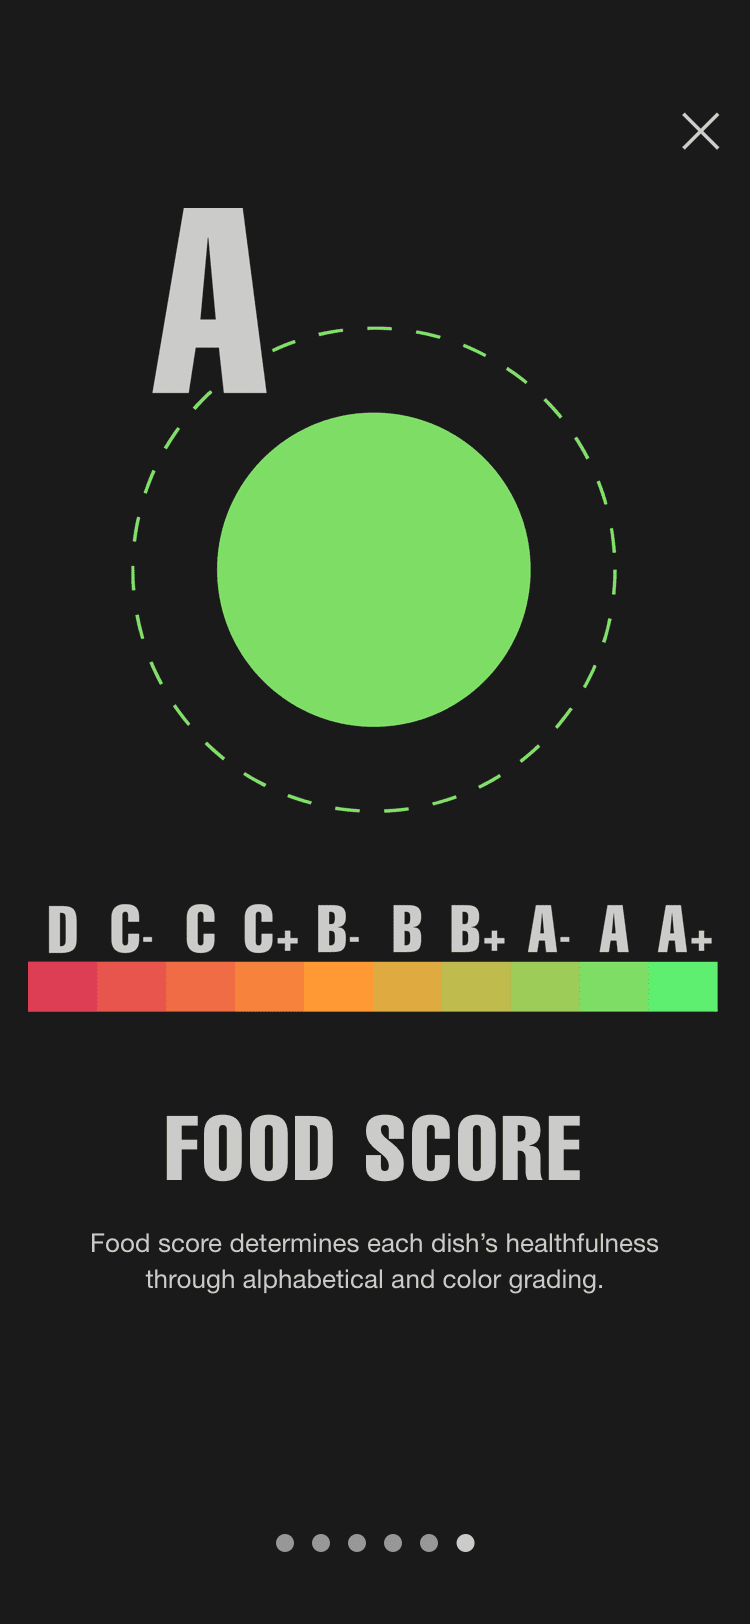
Due to the visualization model's showcasing six varied data, the information page needs to thoroughly introduce the users to how the model function. Furthermore, it is of most importance to address each of the data with a question, which can be answered through the visualization.
The number of Processing Methods / Out of 8 different food processing methods, how many are used on the product?
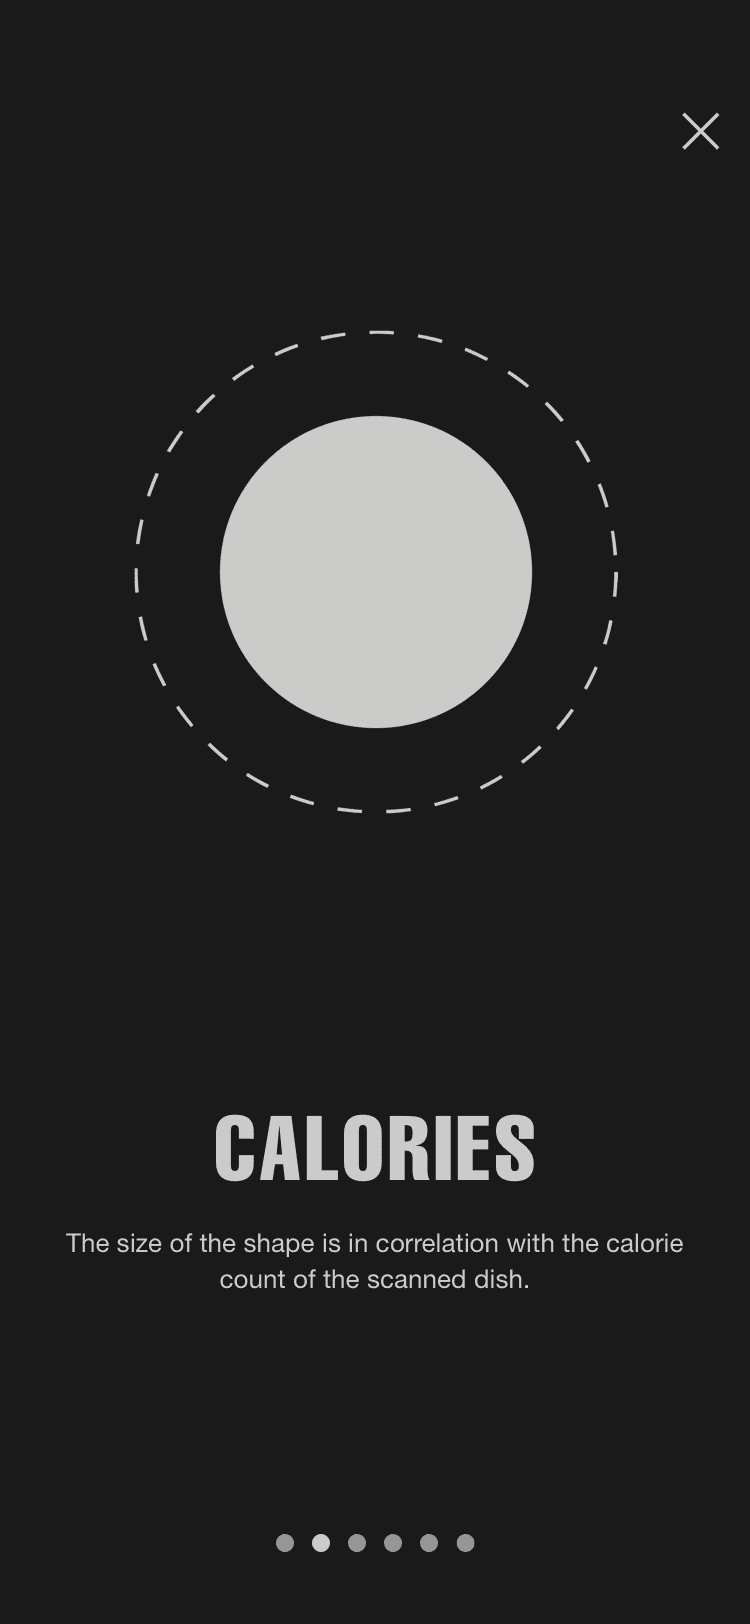
Caloric Intake / How many calories does the disk contain?
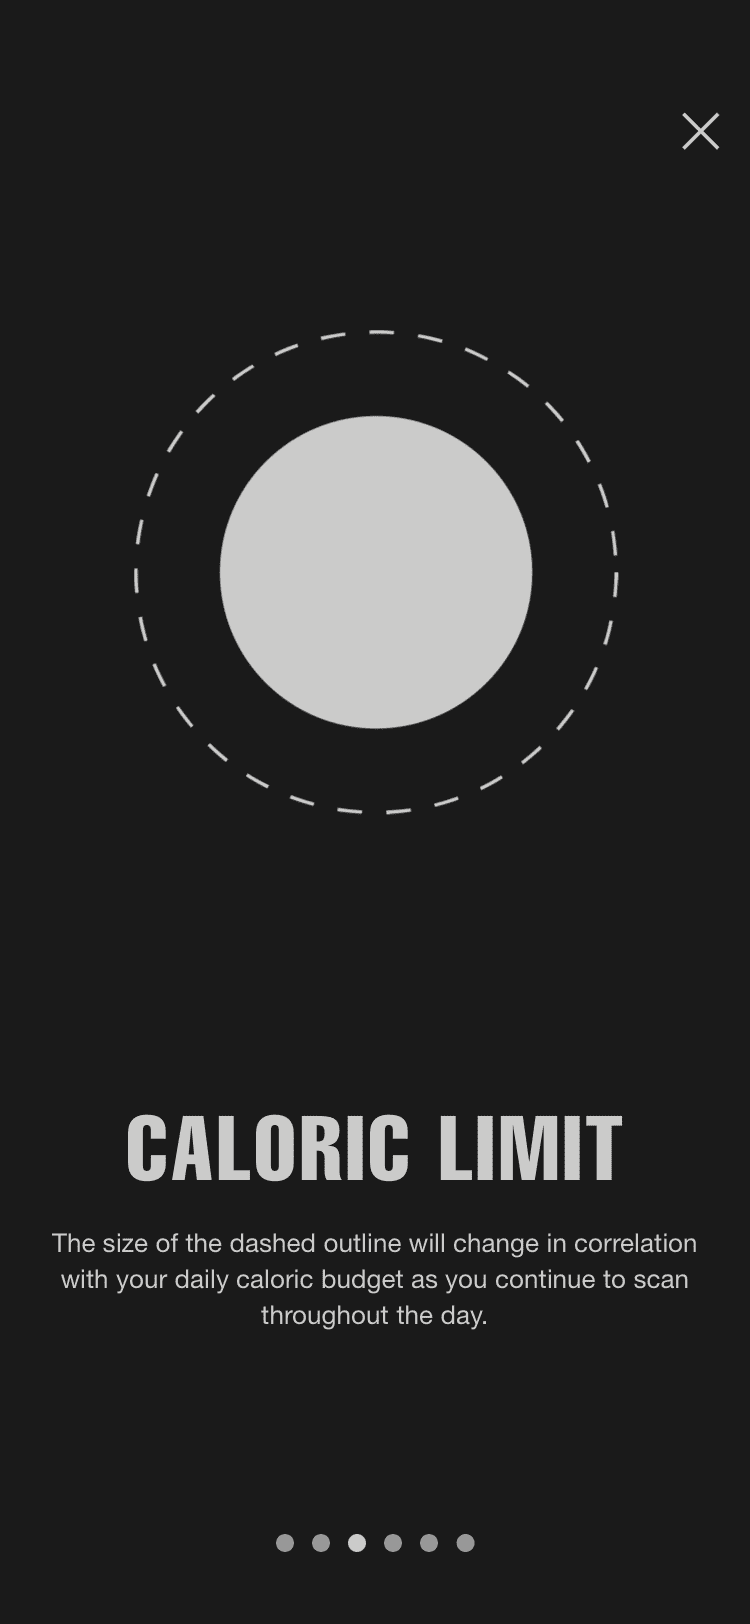
Remaining Caloric Budget / How many calories does the user has left for today?
Macros / What are the percentages of fat, protein, and carb in the product?
Best Macros Input / What is the best macro input of disk submitted by other users?
Food Grade / What is the food grade of the product?
Through the provided information page and onboarding, the users can familiarize themselves with the module.
Information and Historical Breakdown
While the model help users to quickly learn about their current disk and how it affects their daily caloric limit, the breakdown page provides detailed nutrients analysis and their values. Moreover, the application allows for mealy, daily, and monthly comparison of the user's food consumption.


Reflection
Despite the project allowing me to carefully do research and collect data for the data visualization and user interface aspects of application design, due to the time restriction, I was not able to fully explore the user interface and identity design side. In the near future, I hope to continue to develop both the concept and visual design of the project as well as creating a fully interactive prototype for the product. Through this project, I learned how to transform data into visualization models without using templates, how to conduct design research and fortified my ability to use design tools.
CONTACT
CONTACT
CONTACT
CONTACT
CONTACT
I'm currently searching for a full-time position at a creative agency. You can get in touch with me at dmp2897@gmail.com
I'm currently searching for a full-time position at a creative agency. You can get in touch with me at dmp2897@gmail.com
I'm currently searching for a full-time position at a creative agency. You can get in touch with me at dmp2897@gmail.com
I'm currently searching for a full-time position at a creative agency. You can get in touch with me at dmp2897@gmail.com
I'm currently searching for a full-time position at a creative agency. Get in touch with me at dmp2897@gmail.com
Copyright ©️ 2024 Duc Minh Pham. All Rights Reserved
DUC MINH PHAM ©2020
DUC MINH PHAM ©2020
DUC MINH PHAM ©2020
DUC MINH PHAM ©2020